
When seconds count: how we think about flash analyses
Published: 19 March 2026
Seconds make a difference in day trading. But the difference does not arise when you receive the news — it arises when you understand it quickly enough to act.
That is why we built flash analyses: an extremely fast, concise first interpretation of corporate communications, packaged as a single line of text that makes it easy to prioritize and move on.
What this is: how we think when building our fastest analyses — what makes them hard to get right, why the entire chain matters, and why we invest so much in how information actually reaches the user.
Who this is for:
- people who day-trade or want to understand day trading with Quanor better,
- people who want to become faster at absorbing new information,
- people curious about what AI can contribute in a decision process where seconds matter.
What this is not: trading advice — or a copy-and-paste template with all the details.
What is a flash analysis?
Our flash analyses are triggered by corporate communications for the companies we cover. The goal is simple to describe but hard to do well:
Convey what the release actually says — and what was already known — so clearly that a day trader or professional investor can read a single line of text and act.
This is not about writing a long summary. It is about distilling the news to what matters most right now, in a format that works in a fast decision flow.
The chain is only as strong as the weakest link
When people talk about "fast analysis," it is tempting to think it is just about the analysis step itself. In practice, speed is a relay race.
For a flash analysis to feel "instant" to the user, the entire chain must work:
- Publication: the news is published and becomes publicly available.
- Reception: how quickly it reaches us via real-time feed.
- Concurrency: how we handle many simultaneous items without losing control.
- Analysis: how the analysis is produced — including context fetching, extraction, and validation.
- Distribution: how it reaches the user.
- Presentation: how it is displayed so that you can actually act.
A delay in any step eats into the window that makes the flash analysis valuable. We therefore optimize the entire chain as a system, not step by step.
News often arrives fragmented — headline and body text may come as separate messages — and needs to be reassembled before analysis can begin. While that reassembly is happening, we are already preparing context data and fetching any attachments, so that as little time as possible is lost.
Press releases: fast relevance with statistical confidence
Not all corporate communication is quarterly reports. Press releases, regulatory decisions, and other news need to be evaluated and summarized within fractions of a second — but a single model call is not stable enough for something a day trader may act on.
Consensus-based relevance scoring
When a press release arrives, we do not rely on a single AI assessment. Instead, we run multiple independent evaluations in parallel and apply a consensus mechanism to determine relevance. If the evaluations agree early, remaining calls are cancelled immediately — giving us the reliability of redundancy at the latency of a single call.
This is a pattern borrowed from distributed systems and statistical inference: treat each evaluation as an independent signal, and require agreement before publishing a score. The result is a relevance assessment that is both fast and stable — resistant to the occasional instability that any single model call can exhibit.
Multi-phase pipeline with progressive enrichment
The analysis itself runs in phases, each adding depth without blocking the previous:
- Phase 1 produces an initial assessment and is saved immediately — this is the critical path, optimized for speed.
- Phase 2 enriches the analysis with additional context, including company background and recent communications, and can reassess relevance when new information changes the picture.
- Phase 3 performs a deeper review with extended reasoning, full timeline context, and more complete background — producing the kind of nuanced analysis that would take a human analyst considerably longer.
Each phase is designed to fail independently. If a later phase encounters an error, the earlier results remain intact. You always get at least the fast assessment; the deeper layers arrive as they complete.
Context-aware calibration
A 50 million SEK contract means something very different for a company with 200 million in revenue than for one with 20 billion. Our system fetches company context — revenue scale, known investor focus areas, recent communications — and uses it to calibrate the relevance assessment.
This context fetching happens concurrently with the initial evaluation, with graceful degradation: if context arrives in time, it informs the assessment. If not, the analysis proceeds with what is available and can be upgraded asynchronously when richer context arrives.
Beyond language: statistical signal models
The system also incorporates signal models trained on historical patterns — how specific types of news have correlated with market reactions for similar companies and sectors. This moves relevance scoring beyond pure language understanding toward a hybrid approach where statistical patterns complement AI judgment, making the system faster and more precise over time.
Quarterly reports: where precision meets speed
Quarterly reports require something beyond summarization: extracting the right numbers, comparing them against expectations, and formulating a clear picture of the outcome — all within seconds.
This makes report analysis perhaps the hardest problem in the entire flash chain.
Context prepared before the report arrives
A flash analysis at report time has no time to look up background information. The context must be in place before the report is published.
We therefore build a structured brief per company in advance — a kind of playbook — that includes:
- Estimates for the current quarter: revenue, earnings metrics, and other relevant financial measures — generated by our own AI based on the company's prior communications, macro context, and peer comparisons. Each estimate is paired with the prior year's actual as a reference point.
- Company-specific KPIs not captured by standard estimates: metrics that may be decisive for a particular industry or business model (such as recurring revenue, churn, or order values).
- Contextual cues that give the analysis direction: what the market is focusing on, which risks or opportunities are already known.
Having this brief pre-built and structured is a prerequisite for running the analysis with meaningful comparisons within the time frame we aim for.
Why extracting numbers from reports is hard
"Reading a number" from a quarterly report with a language model sounds straightforward. In practice there are pitfalls that make the problem considerably harder:
- Quarterly vs accumulated figures: a report may present Q3 figures alongside January–September figures in the same table. A model that does not know the difference risks reporting the wrong number.
- Unit taxonomy: Nordic reporting uses KSEK, Mkr, MSEK, Mdr, tkr, and many other variants — sometimes inconsistently within the same document.
- Adjusted vs unadjusted metrics: EBITDA, adjusted EBITDA, and underlying EBITDA can all appear, and it is not always clear which metric should be compared against the estimate.
- Format variations: table structures vary significantly across companies, and sometimes between reports from the same company.
The upshot is that a naive extraction — a single model run — has an error rate that is too high for a system where day traders need to trust the output.
Redundancy and consensus checking
Our solution builds on a principle from fault-tolerant systems: instead of trusting a single extraction, we run multiple independent extractions in parallel and require agreement before a result is published.
Each extraction produces a structured tuple — value, unit, and currency — per metric. Agreement is checked at the tuple level, not field by field, because a model that gets the value right but the unit wrong is just as dangerous as one that gets the value wrong.
We monitor results as they arrive in real time. When enough extractions agree, remaining calls are cancelled immediately — cutting tail latency without sacrificing reliability. This gives us the speed of a single call in the best case, with the confidence of a verification step.
If the extractions do not agree sufficiently, no result is published — silence is better than incorrect information in a fast decision flow.
Deterministic checks after extraction
Even when extractions agree, the result passes through a series of deterministic checks before publication. These are not AI-based — they are hard rules that catch systematic error types:
- Period matching: the extracted quarter must match what we expect. Otherwise we risk comparing Q2 figures against Q3 estimates.
- Unit checking: the unit must be reasonable and consistent with the estimate's unit, including detection of order-of-magnitude confusion where values and units are suspiciously misaligned.
- Anchor checking: if the prior year's actual is available in our brief, we compare the model-extracted prior-year value against our known reference value. If the deviation is too large, the model has likely read an accumulated figure instead of the quarterly figure — and we reject the result. This check has proven to be one of the most effective safeguards against the most common error type.
- Plausibility filters: additional checks that catch currency transformation, unit confusion, and other systematic deviations.
Only when all checks pass is the outcome formulated: beat, miss, or inline — in a clear, compact line. The beat/miss determination itself is purely deterministic: no AI judgment, just arithmetic comparison against the pre-built estimate. This is a deliberate design choice — the fewer decisions left to a language model under time pressure, the more trustworthy the output.
Deeper digging when needed
A quarterly report can be brief in its press release but contain detailed figures deeper in attached documents — especially year-end reports, where Q4 figures sometimes do not appear in the summary but only in the financial tables.
If the initial extraction does not find expected metrics, we launch parallel retry tiers across different source materials — full press release text and PDF attachments simultaneously — rather than trying them one at a time. The system picks the best result by source reliability, and can fall back to progressively deeper document analysis when needed.
Any attachments begin downloading in the background as soon as the news arrives, so they are available when needed — without delaying the primary analysis.
Multiple analysis types, published in the order they complete
A report gives rise to several types of flash analyses. For example:
- Estimate comparison: outcome versus estimates — the type that is typically published first.
- Company-specific KPIs: metrics not captured by standard estimates, with year-over-year change.
- Guidance and triggers: notable guidance changes or events highlighted in the report.
- CEO quotes: selected quotes about the quarter's outcome and outlook.
An important design principle: each flash is published the moment it is ready. You do not need to wait for the full analysis to complete before seeing the first — often most important — line.
Quote verification
CEO quotes are valuable for understanding tone and direction. But language models can produce quotes that sound plausible but were never actually written.
We therefore verify every extracted quote against the source text — using a combination of exact and fuzzy matching — and only publish quotes that can be substantiated in the original text. It is a simple principle, but it is critical for trust in a system designed to be used under time pressure.
Aggregate sentiment without AI judgment
The overall sentiment of a report flash — strong, weak, mixed, or in line — is not determined by an AI model. It is computed as a statistical consensus over the individual beat/miss results: if all key metrics beat, the sentiment is strong; if all miss, it is weak; a mix produces a mixed signal.
This means the sentiment you see is fully traceable back to the underlying numbers — there is no hidden AI interpretation. When you see "strong," you can look at the individual metrics and understand exactly why.
Our most important principle: Investor Experience (IX)
We often talk about UX. For us this is even more specific: IX — Investor Experience.
In an extremely fast information flow, presentation is not cosmetics. Presentation is function.
A flash analysis needs to be:
- Clear: what is this?
- Consistent: so you can read quickly without having to "interpret the format" each time.
- Prioritized: what is the core?
- Frictionless: what do I do next?
It is easy to underestimate how much "cognitive latency" exists in noisy feeds. If the user has to re-read, compare, hesitate, and guess, the flash analysis has failed at its purpose. If too much information is presented, filtering functions — such as the relevance assessment — can help the day trader prioritize.
IX is a large part of why we can talk about flash analyses as something practically useful, not just a technical race.
AI and the day trader: who does what?
A common misconception is that AI is supposed to "replace" the day trader. We see it the other way around: the day trader is the execution engine, AI is the enabler.
For a day trader, the chain does not end at insight — it ends at execution. Since order placement happens in terminals like Infront or Bloomberg, and sometimes directly with brokers like Avanza and Nordnet, it is important to look at how friction can be reduced all the way to the right order flow when a relevant piece of news appears.
The day trader has:
- experience and market feel,
- a playbook with triggers and scenarios,
- risk rules and positioning,
- preparation: "if X happens, I do Y."
AI can contribute something different:
- reading and distilling content faster than a human,
- surfacing relevant context from what was already known,
- comparing report outcomes against expectations before the market has reacted,
- digging deeper in less time than a human can manage under pressure.
The power is in the combination:
The flash analysis helps you quickly understand what happened and how it can be interpreted. You execute based on your plan, with your discipline and risk management. And after that, deeper analyses and continued digging can take over when seconds are no longer the scarce resource.
Time to edge vs analysis depth
There is a simple trade-off in nearly all event-driven trading:
- The closer to publication you act, the larger the "window" may be where the market has not yet fully priced in the information.
- At the same time, the opportunity for deeper, more complete analysis increases as more time passes.
Think of it as two curves:
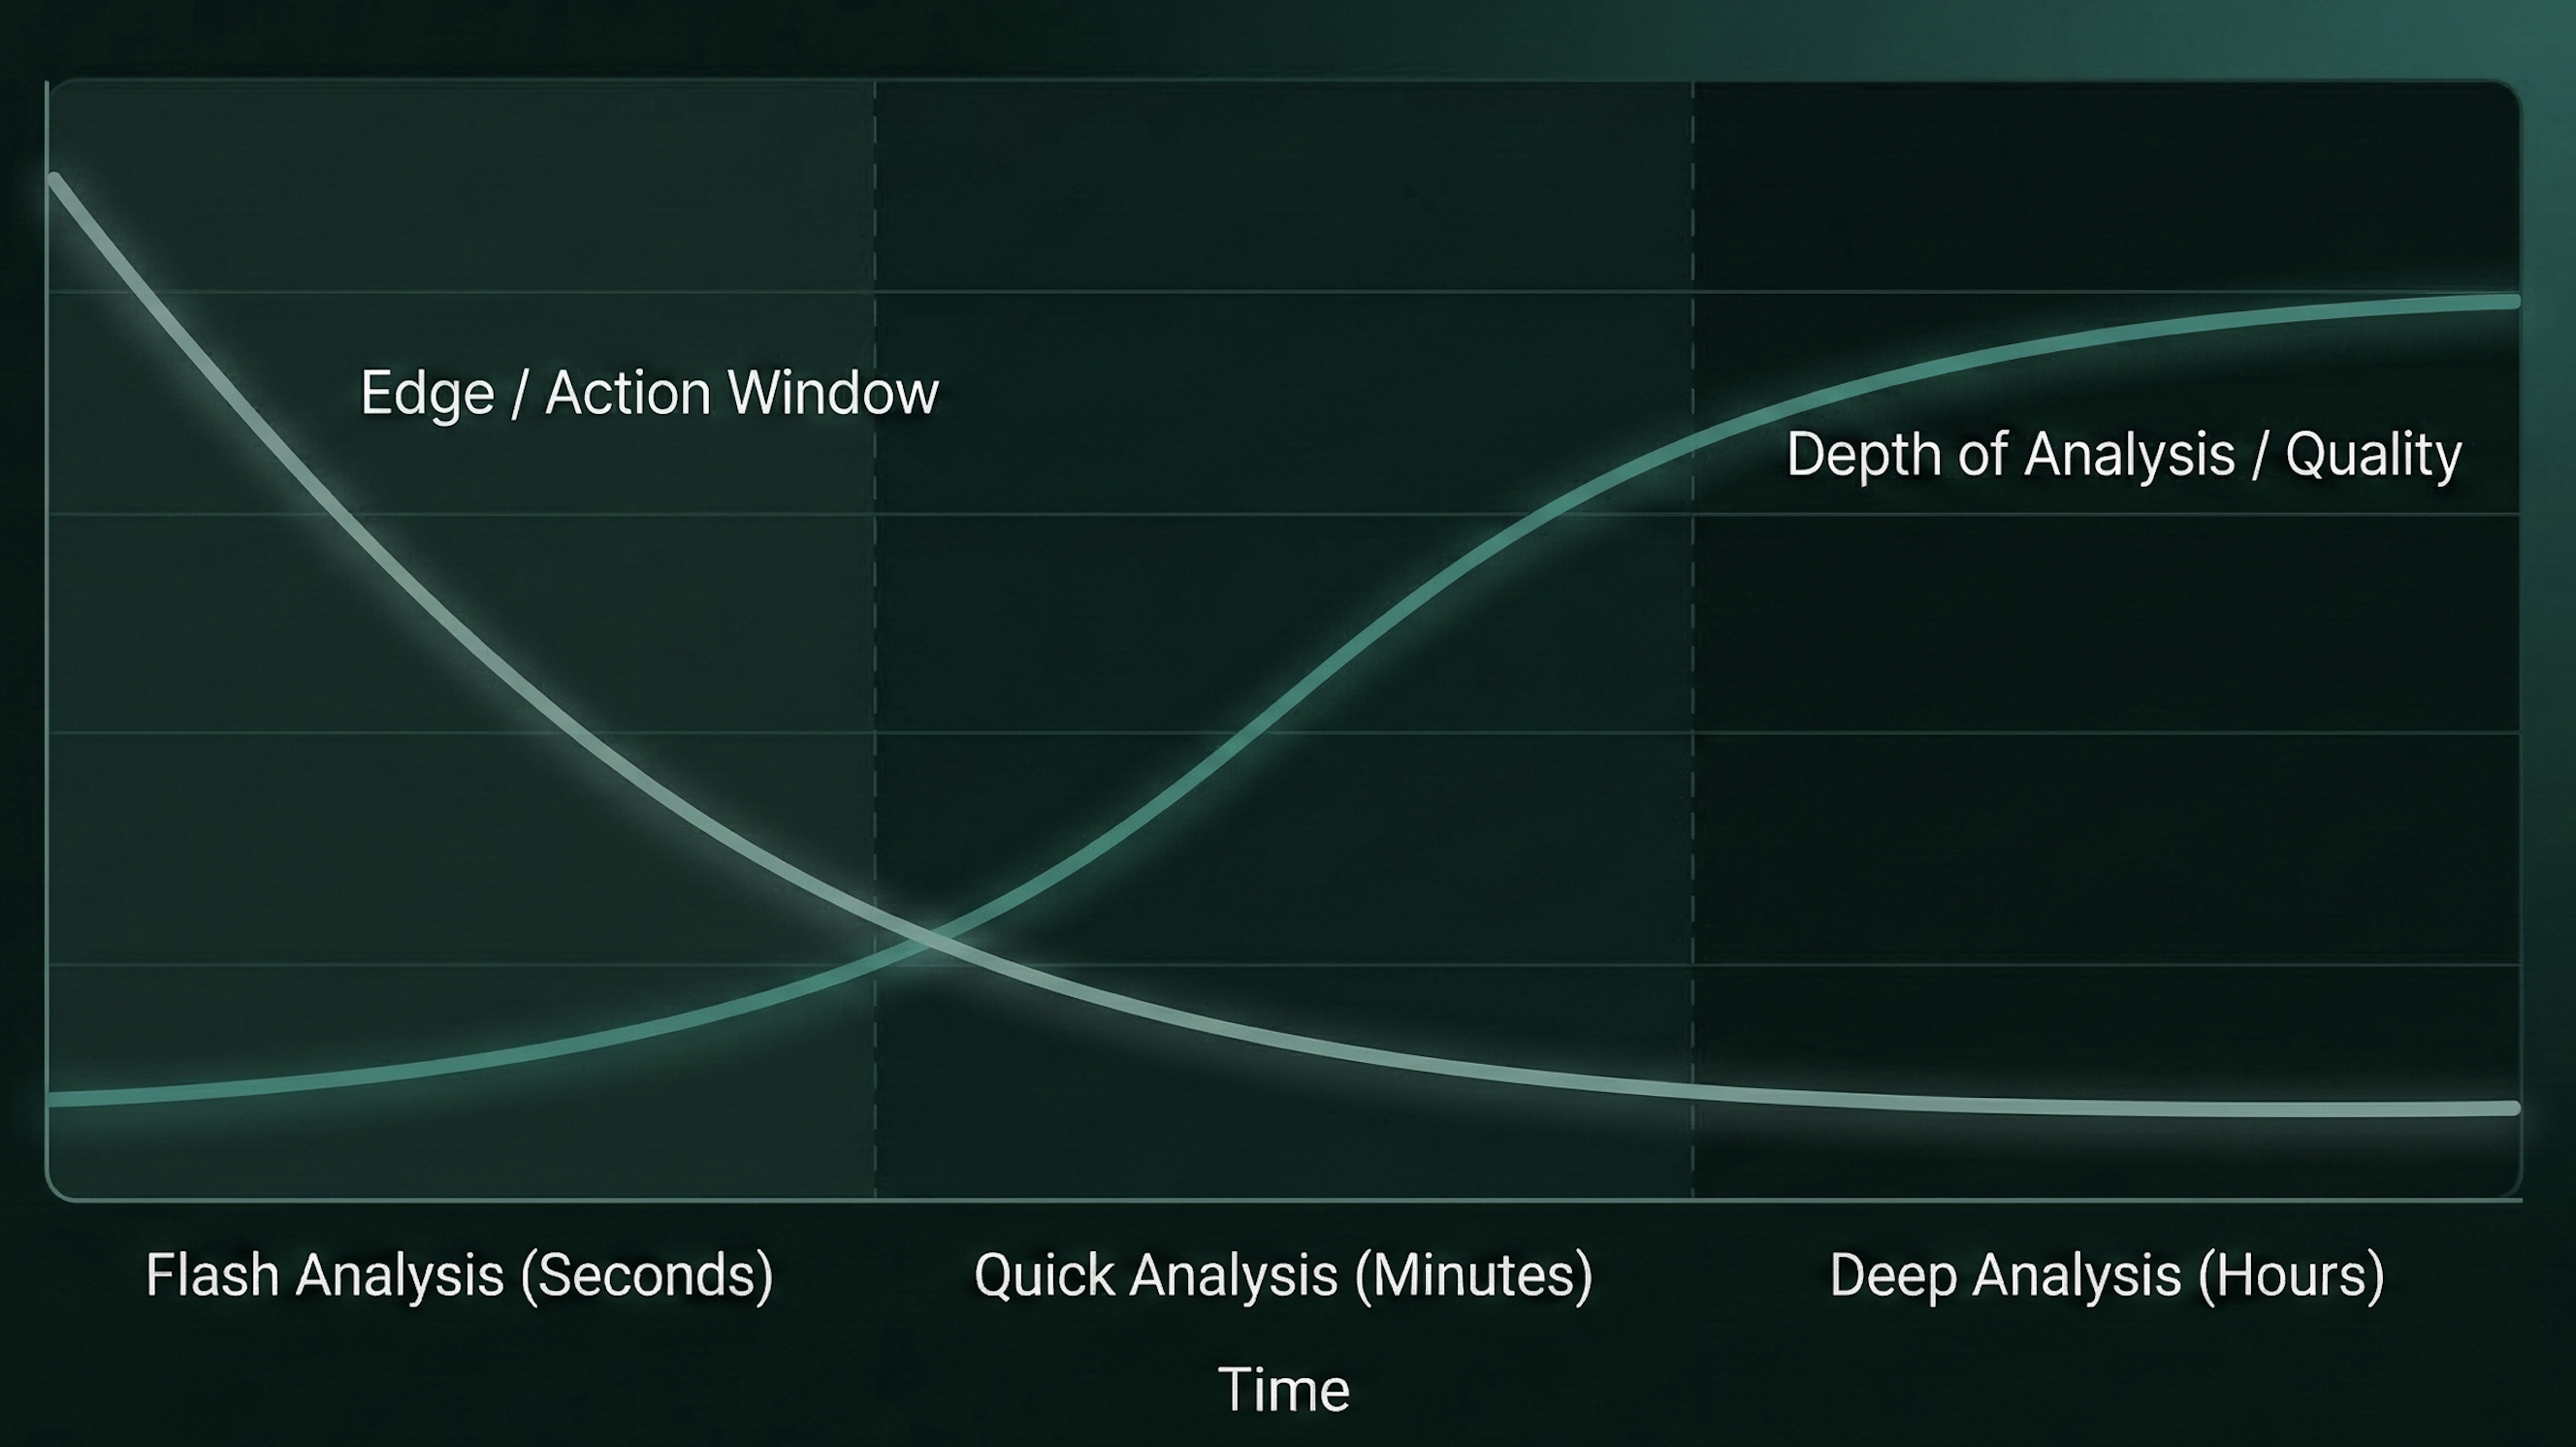
The flash analysis is built for the earliest zone: maximum clarity, minimum friction. Deeper analyses — such as our full report and PR analyses — are built for the next zone: more context, more verification, more complete picture.
In practice you need both, but you need them at different points in time.
Where is AI + fast decisions heading?
We believe the future is moving toward more real-time decision support, but in a way that strengthens the investor rather than taking over.
A few clear directions:
- More copilot behavior: AI helps you follow your playbook, prioritize events, and monitor multiple feeds simultaneously.
- More personalization: the same corporate news item can be "everything" for one strategy and "nothing" for another. Relevance becomes a new superpower.
- Better real-time context: AI can connect the news to prior communications, market reactions, and known factors faster than humans can.
- Statistical learning from outcomes: as more data flows through the system, patterns emerge — which types of news actually moved which stocks, how estimate surprises correlated with price reactions. These signals can sharpen both relevance scoring and analysis over time, complementing language understanding with quantitative pattern recognition.
What is interesting is that this is not just about being fast. It is about being fast in the right way: with clarity, trust, and an interface that fits how decisions are actually made.
Flash analyses at Quanor
Want to try how flash analyses feel in practice? With our Pro offering you get access to these analyses, and all our other analyses.
Disclosure: This article describes how a production system works. It is not investment advice. Flash analyses are decision support, not trading recommendations.